HOME > Football
The "deserved" standings of the Premier League after 11 rounds: Who is performing above and beyond, and who is not living up to expectations?
10:47am, 16 November 2025【Football】
As the saying goes, it will be more valuable to look at the standings after the league has played at least 10 rounds. Now that the 11th round of the 2025-26 Premier League season is over, it is indeed time to take a closer look - but we still need to remain cautious.
Historical data shows that more than half (11 out of 20 times) of the leaders of the Premier League after 11 rounds will eventually win the championship trophy. Although the team that takes the lead at the start often sets the tone, there is always the possibility of a comeback. After all, the 11 rounds are only a tiny slice of the 38-round season, and the opponents encountered by each team vary in intensity. A team that starts with a tough schedule may actually have fewer points than it performs on the field, while a team with a loose schedule may look better than it really is.
This is where data models come in. Expected goals (xG) and Opta’s expected points model can reveal a team’s true performance more deeply. By running thousands of match simulations based on the quality and quantity of shots taken, the model calculates how many points a team "should" have earned - even if the advantage doesn't translate into goals, dominance and quality chances are still weighted accordingly.
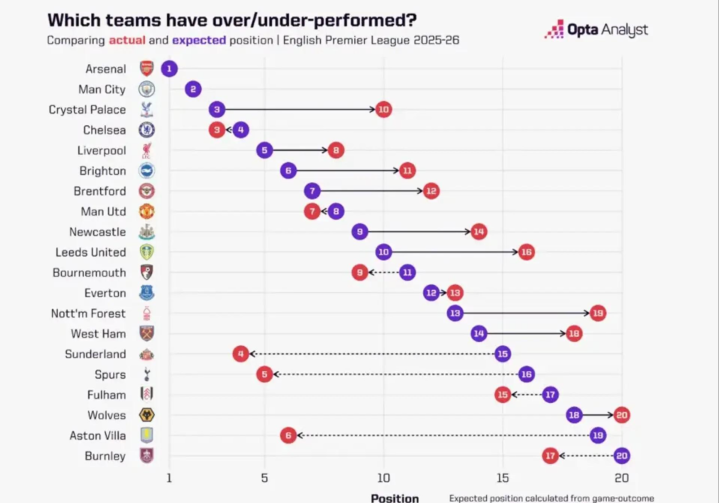
This picture shows the comparison between the actual ranking and the expected ranking of each English Premier League team in the 2025-26 season. It is used to analyze which teams "exceeded expectations" (the actual ranking was better than expected) and which teams were "below expectations" (the actual ranking was worse than expected).
Core Logic
·The purple dot represents the expected ranking (calculated through simulation calculations based on the game results based on personal shooting xG);
·The red dot represents the actual ranking;
·The arrow connects the two, intuitively reflecting the gap between actual and expected.
Team performance classification
1. Exceeding expectations (actual ranking > expected ranking, red point is to the left of the purple point)
·The actual results of these teams are better than expected by the data model:
·Chelsea: expected 4th → actual 3rd
·Manchester United: expected 8th → actual 7th
·Bournemouth: expected 11th → Actual 9th
·Sunderland: Expected 15th → Actual 4th (huge gap, outstanding performance beyond expectations)
· Tottenham: Expected 16th → Actual 5th (huge gap, outstanding performance beyond expectations)
· Aston Villa: Expected 19th → Actual 6th (huge gap, outstanding performance beyond expectations)
· Fulham: Expected 17th → Actual No. 15
·Burnley: Expected 20th → Actual No. 17
2. Lower than expected (actual ranking
·The actual results of these teams are not as good as the data model expected:
·Crystal Palace: Expected 3rd → Actual 10th (the gap is huge, significantly lower than expected)
·Liverpool: Expected 5th → Actual 8th
·Brighton: Expected 6th → Actual 11th
· Brentford: Expected 7th → Actual 12th
· Newcastle: Expected 9th → Actual 14th
· Leeds United: Expected 10th → Actual 16
· Nottingham Forest: Expected 13th → Actual 19
· West Ham: Expected 14th → Actual No. 18
·Wolves: Expected No. 18 → Actual No. 20
3. In line with expectations (actual and expected rankings are consistent)
·Arsenal: Expected No. 1 → Actual No. 1
·Manchester City: Expected No. 2 → Actual No. 2
Through this chart, we can intuitively see the deviation of each team's performance from the data expectations, helping to understand whether the team is "relying on strength to perform beyond the level" or "underperforming the data potential"
Of course, this system is not perfect, it cannot take into account specific game situations such as chasing a victory or holding on to the lead, nor does it take into account long periods of possession without a shot. . But at the 11th round, it is still an effective tool to gain insight into the real performance and identify the overachievers and underachievers.
In short, the standings only present part of the truth, and the data model pieces together the complete picture. As the season pattern begins to emerge, the 2025-26 Premier League expected standings provide fans with a unique perspective on teams that exceed expectations and those that fall short of expectations.
Related Posts
- TA: Arsenal set to appoint Italian scout Maurizio Micheli to senior recruitment role
- Received a claim of 30 million! Portuguese media: Inter won the lawsuit and settled the transfer dispute with Sporting CP over Mario
- Next week s match against Barcelona! French media: Not only Vitinia, K77 was replaced by Paris due to thigh discomfort
- Unit: Decaitlare participated in some joint training and is expected to play in Juventus on the weekend
- Gallish questioned the referee: It is unheard of for a quick free kick to dye the yellow, Liverpool fans will blow it
- Reporter talks about the FA s accusation of Chelsea of failure to declare commission truthfully, the Blues advocate no competitive punishment
- Official: 29-year-old Turin striker Sanabria joins Cremona for permanent transfer
- Tonight s Hong Kong showdown! Golden Boot Ronaldo VS Champion Benzema! Saudi Super Cup semi-final focus game
- Media person: Liu Shaoziyang is the main candidate for strengthening the position of Guoan goalkeeper
- Overseas intelligence: Almaty 1-0 Olympia
Hot Posts
- TA: Arsenal set to appoint Italian scout Maurizio Micheli to senior recruitment role
- Received a claim of 30 million! Portuguese media: Inter won the lawsuit and settled the transfer dispute with Sporting CP over Mario
- Next week s match against Barcelona! French media: Not only Vitinia, K77 was replaced by Paris due to thigh discomfort
- Unit: Decaitlare participated in some joint training and is expected to play in Juventus on the weekend
Recommend

Tattoo artist: I don’t think I was betrayed by Spalletti, getting a tattoo does not mean staying in Naples forever

Messi suffered a 0-4 loss in his sixth career, with the biggest defeat to Barcelona 2-8 Bayern
Exciting night: England 2-0, Portugal starts well 5-0, Ronaldo and Felix are invincible double shots

From Ronaldo to Dzekelès, why are the Premier League so obsessed with Portuguese League players?
Say goodbye to 55,000 weekly salary⁉️Sky exclusive: Diaz will discuss contract renewal with Liverpool at the end of the season
The legend is back! Terry, Cahill: Hazard Costa is in good form; hopes to revenge against Liverpool

Georgina brings her children to watch the football match! 40-year-old Ronaldo wins the championship again, and he feels youthful in the same frame with his fiancée
TA: Manchester United U21 and U18 have no place to stay in the new base, and the toilets in the old building where they wander are not cleaned.